Market Outlook
July 10, 2018
Market Cues
Domestic Indices
Chg (%)
(Pts)
(Cl ose)
Indian markets are likely to open positive tracking global indices and SGX Nifty.
BSE Sensex
0.8
277
35,935
U.S. stocks moved sharply higher over the course of the trading session on Monday,
Nifty
0.7
80
10,852
extending the strong upward move seen in the previous session. The Dow Jones was
Mid Cap
1.2
189
15,581
increased by 1.3% to 24,776 and the Nasdaq rose by 0.9% to 7,756.
Small Cap
1.6
254
16,313
U.K. stocks were moving higher and the pound also rose against both the dollar
Bankex
0.9
277
29,659
and the euro, as the resignation of Brexit secretary David Davis helped fuel
expectations that a soft Brexit was more likely. The benchmark FTSE 100 inched up
Global Indices
Chg (%)
(Pts)
(Cl ose)
by 0.3% to 7,641.
Dow Jones
1.3
320
24,776
On domestic front, Indian shares closed higher during the last trading session as
Nasdaq
0.9
68
7,756
investors put trade worries on the back burner and shifted focus to the upcoming
FTSE
0.3
24
7,641
earnings season. The BSE Sensex was up by 0.8% to 35,935.
Nikkei
1.2
264
22,052
News Analysis
Hang Seng
1.3
373
28,688
Tata Steel to sell iron ore to Bhushan Steel at arm's length pricing
Shanghai Com
2.5
68
2,815
Detailed analysis on Pg2
A dvances / Declines
BSE
NSE
Investor’s Ready Reckoner
Advances
1,708
1,039
Key Domestic & Global Indicators
Declines
907
749
Stock Watch: Latest investment recommendations on 150+ stocks
Unchanged
166
84
Refer Pg5 onwards
Volumes (` Cr)
Top Picks
C MP
Target
U psi de
BSE
2,405
C ompany
Sector
R ating
(`)
(`)
(%)
NSE
28,711
Blue Star
Capital Goods
Buy
652
867
33.0
Dewan Housi ng Finance
Financials
Buy
618
720
16.5
Parag Milk F oods
Others
Buy
310
410
32.1
Net Inflows (` Cr)
Ne t
Mtd
Ytd
Bata India
Others
Buy
825
896
83.0
FII
251
496
-4,343
KEI Industrie s
Capital Goods
Buy
412
589
43.0
*MFs
2,353
8,907
68,279
More Top Picks on Pg4
Key Upcoming Events
Top Gainers
Price (`)
Chg (%)
Previous
C onsensus
D ate
Region
Event Description
ReadingExpectations
TIMETECHNO
140
13.1
Jul 10, 2018
US
Unnemployment rate
4.00
3.80
HEXAWARE
509
13.1
Jul 10, 2018
China
Consumer Price Index (YoY)
1.80
1.90
ICIL
79
8.9
Jul 11, 2018
India
Imports YoY%
14.85
STRTECH
315
8.6
Jul 12, 2018
US
Producer Price Index (mom)
1.00
JINDALSAW
84
8.2
Jul 12, 2018
US
Initial Jobless claims
231.00
More Events on Pg7
Top Losers
Price (`)
Chg (%)
BEL
108
-2.7
DEN
60
-2.7
AVANTI
464
-2.4
INOXWIND
80
-2.3
ICRA
3384
-2.1
As on July 09, 2018
Market Outlook
July 10, 2018
News Analysis
Tata Steel to sell iron ore to Bhushan Steel at arm's length pricing
Tata Steel has got the Odisha government's nod to sell iron ore from its captive
Khandabandh mine in the state to its newly acquired Bhushan Steel plant.
Though Bhushan Steel Ltd (BSL), in which Tatas have acquired 72.65 per cent
stake, has become a subsidiary of Tata Steel, the latter requires the permission of
the state government to supply ore from its captive mine, as BSL continues to be a
separately listed entity. Khandabandh mine at present supplies ore to Tata
Steel’s Kalinganagar facility, which is considered to be an internal captive
transaction. But unlike that, the supplies to Bhushan Steel will be in the form of
‘sale’ under the principle of ‘arm’s length pricing’, that means the transaction
price should be the same as if the two companies involved were indeed two
independents, not part of the same corporate structure.
Tata Steel is already selling ore to another subsidiary of it in the state, Tata
Sponge, under the same principle of arm’s length pricing from its captive mines.
Tata Steel is in the process of raising the capacity of its Khandabandh mine to 8
million tonne of iron ore per annum. The mine is now supplying 60,00 to 70,000
tonne of ore per month to Kalinganagar plant. As the company is poised to ramp
of the capacity, both at Kalinganagar and Bhushan Steel, apart from raising the
capacities of its own mines, the company is also looking to buy more ore from
external sources including the state owned Odisha Mining Corporation (OMC).
Tatas have about 50 sq km of iron ore/manganese lease in Odisha while most of
the output from these mines goes to feed the company’s Jamshedpur plant.
Economic and Political News
Corporate News
Market Outlook
July 10, 2018
Top Picks
Market Cap
C MP
Target
Upside
C ompany
R ationale
(` Cr)
(`)
(`)
(%)
Favorable outlook for the AC industry to augur well
for Cooling products business which i s out paci ng
Blue Star
6,366
662
867
31.0
the market growth. EMPPAC division's profitability to
improve once operating environment turns around.
With a focus on the low and medium income (LMI)
consumer se gme nt, the company has increased its
Dewan Housi ng Finance
19,525
622
720
15.8
presence in tier-II & III cities where the growth
opportunity i s immense.
Well capitalized with CAR of 18.1% which gives
sufficient room to grow asset base. Faster resolution
ICICI Bank
1,74,464
271
416
53.5
of NPA would reduce provision cost, which w ould
help to re port better ROE.
High order book execution in EPC segment, rising
KEI Industrie s
3,223
411
589
43.3
B2C sales and hi gher exports to boost the revenues
and profitability
Expected to benefit from the lower capex
Music Broadcast Limited
1,745
306
475
55.2
requirement and 15 year long radio broadcast
licensing.
Strong brands and distribution network would boost
Siyaram Silk Mills
2,483
530
851
60.6
growth going ahe ad. Stock currently trade s at an
inexpensive valuation.
GST regime and the Gujarat plant are expected to
Maruti Suzuki
2,83,032
9,369
10,619
13.3
improve the company’s sale s volume and margins,
respectively.
We expect loan book to grow at 24.3% over next
GIC Housing
1,897
352
655
86.0
two year; change in borrowing mix will help in NIM
improve ment
Third largest brand play in luggage se gment
Increase d product offerings and i mproving
Safari Industries
1,452
651
720
10.6
distribution network is leading to strong growth in
busine ss. Likely to post robust growth for next 3-4
years
We expect financi alisation of savings and
Aditya Birla Capital
28,231
128
218
70.3
increasing penetration in Insurance & Mutual fund
would ensure steady growth.
One of the leading Indian dairy products
companie s in India cre ated strong brands in dairy
products. Rising revenue share of high-margin
Parag Milk F oods
2,588
308
410
33.1
Value Added Products and reduction in interest cost
is likely to boost margins and earnings in next few
years.
We expect MCL to report net revenue CAGR of
~15% to ~`450cr over FY2018-20E mainly due to
strong growth i n online matchmaking & marriage
Matrimony.com Ltd
1,694
745
1,016
36.3
related services. On the bottom-line front, we
expect a CAGR of ~28% to `82cr over the same
period on the back margin improve ment.
HDFC Bank maintained its ste ady growth in the
4QFY18. The bank’s net profit grew by
20.3%.
Steady growth in interest income and other income
HDFC Bank
5,52,420
2,121
2,315
9.1
aided PAT growth. The Strong liability franchise and
healthy capitalisation provides strong earni ng
visibility. At the current market price, the bank is
trading at 3.2x FY20E ABV.
Source: Company, Angel Research
Market Outlook
July 10, 2018
Top Picks
Market Cap
C MP
Target
Upside
C ompany
R ationale
(` Cr)
(`)
(`)
(%)
We expect strong PAT growth on back of healthy
growth in automobile segment (on back of new
launche s and facelifts in some of the model ) and
M&M
1,15,977
932
1,050
12.7
strong growth in Tractors se gment coupled by its
strong brand recall and improveme nt in rural
sentiment
Market leader in the room air conditioner (RAC)
outsourced manufacturi ng space in Indi a with a
market share of 55.4%. It is a one-stop solutions
Amber Enterprise s
3,191
1,015
1,230
21.2
provider for the major brands i n the RAC industry
and currently serve s eight out of the 10 top RAC
brands in India
BIL is the l argest footwear retailer in Indi a,
offering footwear, acce ssories and bags across
brands. We expect BIL to report net PAT CAGR of
Bata India
10,773
838
948
13.5
~16% to ~` 3115cr over FY2018-20E mainly due
to new product launches, higher number of store s
addition and focus on women’s high growth
segment and margin i mprovement
SHTF is in the sweet spot with benefits from
stronger CV volumes, NIMs unaffected by rising
Shriram Transport Finance
25,866
1,140
1,764
54.7
bond yields on the back of stronger pricing power
and an enhancing ROE by 750bps over FY18-
20E, supported by decline in cre dit cost.
We expect JSPL’s top line to grow at 27% CAGR
over FY19-F Y20 on the back of strong steel
demand and capacity addition. On the bottom
Jindal Steel & Power Limited
21,425
221
350
58.3
line front, we expect JSPL to turn in to profit by
FY19 on back of strong operating margin
improve ment.
GMM Pfaudler Limited (GMM) is the Indi an
market leader in glass-lined (GL) steel equipme nt.
GMM is expecte d to cross CAGR
15%+ in
GMM Pfaudler Ltd
1,211
829
1,020
23.0
revenue over the next few years mainly led by
uptick in de mand from user industries and it is
also expecting to increase its share of non -GL
busine ss to 50% by 2020.
Aurobindo Pharmaceuticals, amongst the Indi an
Pharmaceutical companies, is well pl aced to face
the challenging generic markets, given its focus
on achieving growth through productivity.
Aurobindo Pharmaceutical s
36,510
623
780
25.2
Aurobindo will report net revenue & net profit
CAGR of ~13% & ~8% resp. during FY2018-
20E. Valuati ons are cheap V/s its peers and own
fair multiples of 17-18x.
Well planned strategy to grow small business
loans and cross-selling would propel fees income.
Yes Bank
83,423
362
418
15.5
We expect YES to grow its advance much higher
than industry and improve ment in asset quality to
support profitability.
We believe advance to grow at a healthy CAGR of
35% over FY18-20E. Below peers level ROA (1.2%
RBL Bank
24,350
579
670
15.7
FY18) to expand led by margin expansion and
lower credit cost.
Source: Company, Angel Research
Market Outlook
July 10, 2018
Fundamental Call
Market Cap
C MP
Target
Upside
C ompany
R ationale
(` Cr)
(`)
(`)
(%)
CCL is likely to maintain the strong growth
CCL Products
3,642
274
360
31.4
trajectory over FY18-20 backed by capacity
expansion and new geographical foray
We forecast Nilkamal to report top-line CAGR of
~9% to `2,635cr over FY17-20E on the back of
Nilkamal
2,439
1,635
2,178
33.2
healthy de mand growth in plastic division. On the
bottom-line front, we estimate
~10% CAGR to
`162cr owing to improve ment in volumes.
Elantas Beck India is the Indian market leader in
liquid insulation segment used in electrical
equipme nts like motors, transformers etc. It derives
Elantas Beck India Ltd
1,644
2,074
2,500
20.5
demand from several industries which are expected
to register 10%+ CAGR in demand in the coming
years.
Greenply Industries Ltd (GIL) manufactures plywood
& allied products and me dium density fibreboards
(MDF). GIL to report net revenue CAGR of ~14% to
Greenply Industries
2,611
213
395
85.4
~`2,478cr over FY2017-20E mainly due to healthy
growth in plywood & lamination business on the
back of strong brand and di stribution network
L&T Fin’s new management i s on track to achieve
L&T Finance Hol ding
30,036
150
210
40.1
ROE of 18% by 2020 and recent capital infusion of
`3000cr would support advance growth.
Market Outlook
July 10, 2018
Quarterly Bloomberg Brokers Consensus Estimate
Indusind Bank - July 10, 2018
Particulars ( ` cr)
1QFY19E
1QFY18
y-o-y (%)
4QFY18
q-o-q (%)
PAT
1038.6
836.5
24.2
953
8.9
TCS Ltd - July 10, 2018
Particulars ( ` cr)
1QFY19E
1QFY18
y-o-y (%)
4QFY18
q-o-q (%)
Sales
33,966
29,584
14.8
32,075
5.9
EBIDTA
8,872
7,413
19.7
8,652
2.5
%
26.1
47.9
47.1
PAT
6,985
5,950
17.4
6925
0.9
Market Outlook
July 10, 2018
Key Upcoming Events
Global economic events release calendar
Bloomberg Data
Date
Time Country
Event Description
Unit
Period
Last Reported
Estimated
Jul 10, 2018
6:00 PMUS
Unnemployment rate
%
Jun
4.00
3.80
7:00 AMChina
Consumer Price Index (YoY)
% Change
Jun
1.80
1.90
Jul 11, 2018
India
Imports YoY%
% Change
Jun
14.85
Jul 12, 2018
US
Producer Price Index (mom)
% Change
Jun
1.00
6:00 PMUS
Initial Jobless claims
Thousands
Jul 7
231.00
India
Exports YoY%
% Change
Jun
20.18
5:30 PMIndia
Industrial Production YoY
% Change
May
4.90
5.90
6:00 PMUS
Consumer price index (mom)
% Change
Jun
0.20
0.20
Jul 13, 2018
China
Exports YoY%
% Change
Jun
12.60
10.40
Jul 16, 2018
7:30 AMChina
Industrial Production (YoY)
% Change
Jun
6.80
6.50
12:00 PMIndia
Monthly Wholesale Prices YoY%
% Change
Jun
4.43
7:30 AMChina
Real GDP (YoY)
% Change
2Q
6.80
6.70
Jul 17, 2018
6:45 PMUS
Industrial Production
%
Jun
(0.09)
2:00 PMUK
Jobless claims change
% Change
Jun
(7.70)
Jul 18, 2018
6:00 PMUS
Building permits
Thousands
Jun
1,301.00
6:00 PMUS
Housing Starts
Thousands
Jun
1,350.00
2:30 PMEuro Zone
Euro-Zone CPI (YoY)
%
Jun F
2.00
2:00 PMUK
CPI (YoY)
% Change
Jun
2.40
Jul 23, 2018
7:30 PMEuro Zone
Euro-Zone Consumer Confidence
Value
Jul A
(0.50)
7:30 PMUS
Existing home sales
Million
Jun
5.43
Jul 24, 2018
1:00 PMGermany
PMI Services
Value
Jul P
54.50
1:00 PMGermany
PMI Manufacturing
Value
Jul P
55.90
Jul 25, 2018
7:30 PMUS
New home sales
Thousands
Jun
689.00
Jul 26, 2018
5:15 PMEuro Zone
ECB announces interest rates
%
Jul 26
-
Source: Bloomberg, Angel Research
Market Outlook
July 10, 2018
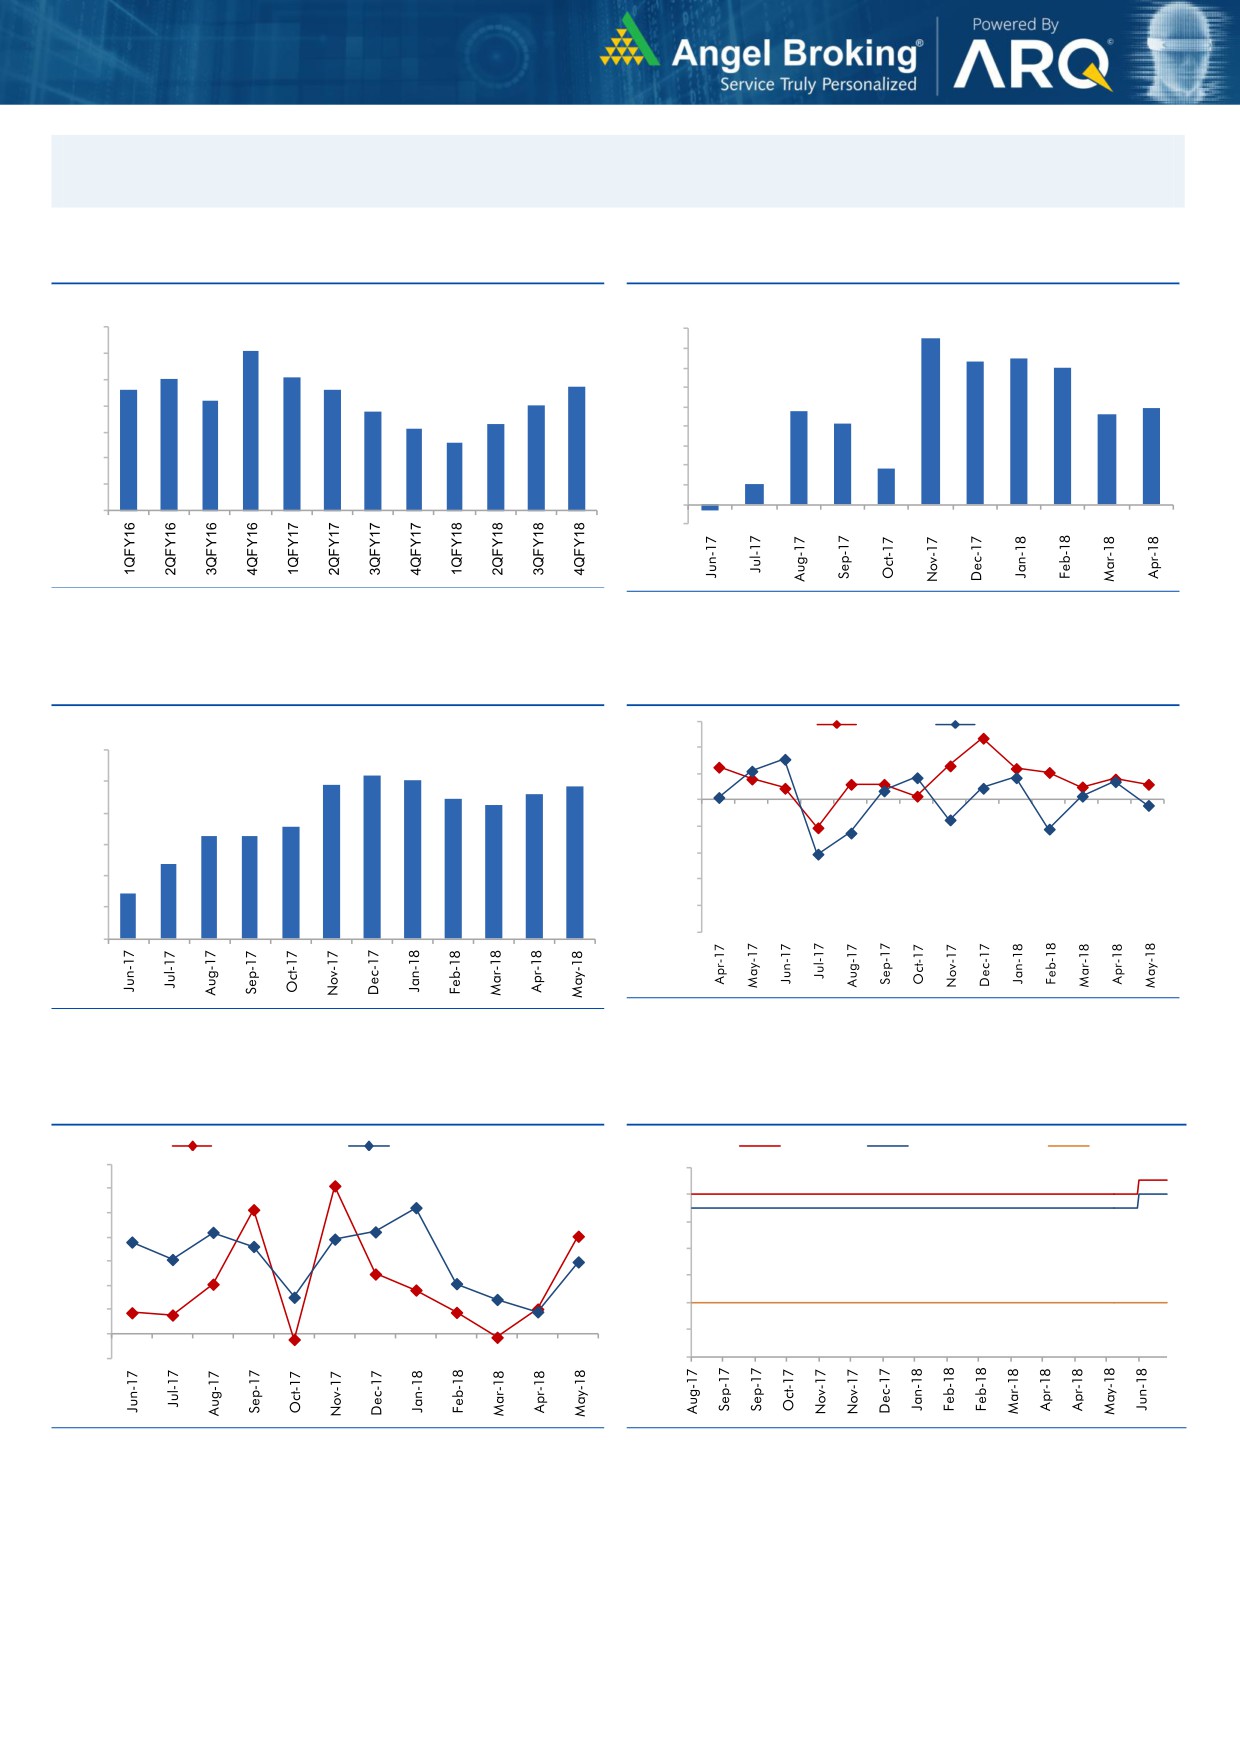
Macro watch
Exhibit 1: Quarterly GDP trends
Exhibit 2: IIP trends
(%)
(%)
8.5
10.0
9.0
9.1
7.3
7.5
8.0
7.0
9.0
8.0
8.1
7.6
7.6
7.7
7.0
8.0
7.2
7.0
6.0
6.8
4.8
4.6
4.9
7.0
6.3
5.0
4.1
6.1
5.6
4.0
6.0
3.0
1.8
5.0
2.0
1.0
4.0
1.0
-
3.0
(1.0)
(0.3)
Source: CSO, Angel Research
Source: MOSPI, Angel Research
Exhibit 3: Monthly CPI inflation trends
Exhibit 4: Manufacturing and services PMI
56.0
Mfg. PMI
Services PMI
(%)
6.0
54.0
5.2
5.1
4.9
4.9
52.0
5.0
4.4
4.6
4.3
50.0
4.0
3.6
3.3
3.3
48.0
3.0
2.4
46.0
2.0
1.5
44.0
1.0
42.0
40.0
-
Source: Market, Angel Research; Note: Level above 50 indicates expansion
Source: MOSPI, Angel Research
Exhibit 5: Exports and imports growth trends
Exhibit 6: Key policy rates
(%)
Exports yoy growth
Imports yoy growth
(%)
Repo rate
Reverse Repo rate
CRR
35.0
6.50
30.0
6.00
25.0
5.50
20.0
5.00
15.0
4.50
10.0
4.00
5.0
3.50
0.0
(5.0)
3.00
Source: Bloomberg, Angel Research
Source: RBI, Angel Research
Market Outlook
July 10, 2018
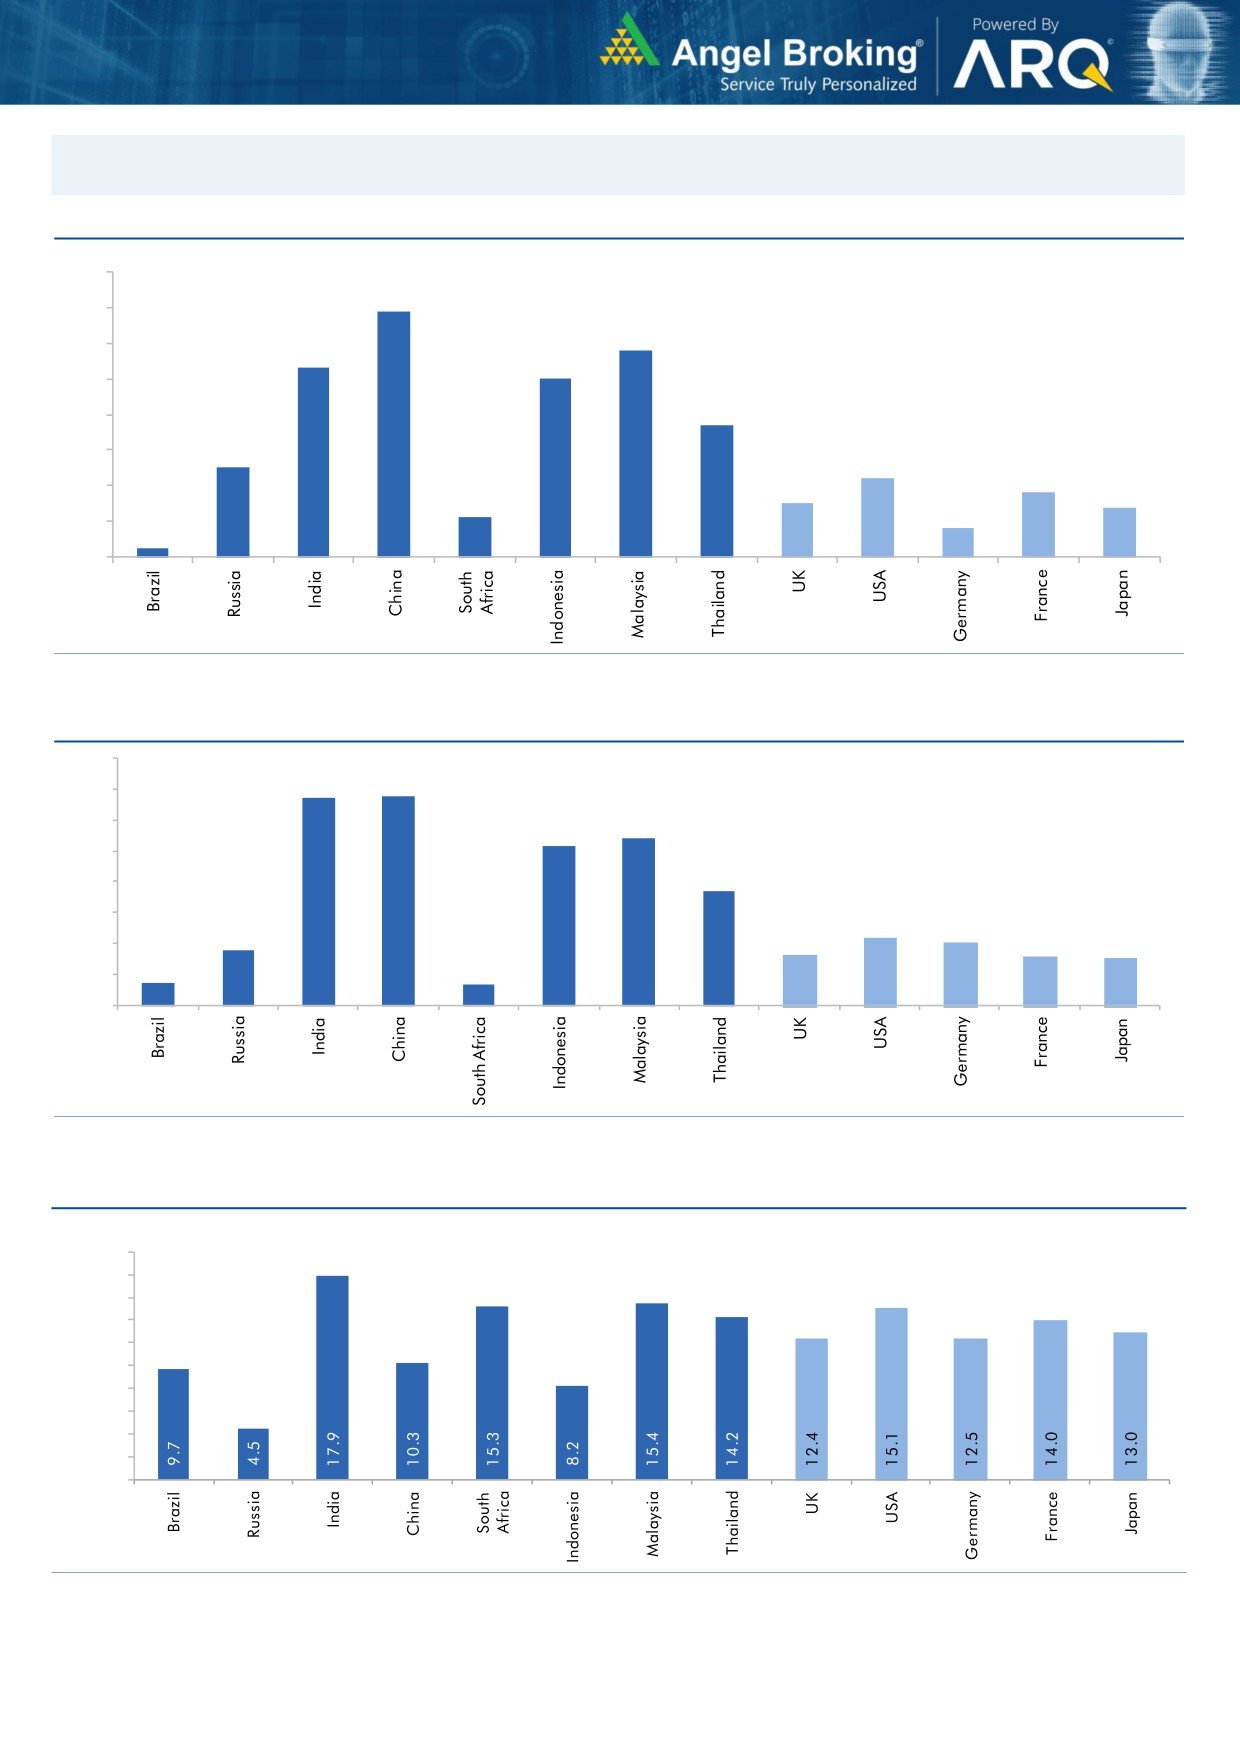
Global watch
Exhibit 1: Latest quarterly GDP Growth (%, yoy) across select developing and developed countries
(%)
8.0
6.9
7.0
5.8
6.0
5.3
5.0
5.0
1.1
3.7
4.0
2.5
3.0
2.2
1.8
2.0
1.5
1.4
0.8
1.0
0.3
-
Source: Bloomberg, Angel Research
Exhibit 2: 2017 GDP Growth projection by IMF (%, yoy) across select developing and developed countries
(%)
6.7
6.8
7.0
6.0
5.4
5.2
5.0
3.7
4.0
3.0
1.8
2.2
2.0
1.7
1.6
2.0
0.7
1.5
0.7
1.0
-
Source: IMF, Angel Research
Exhibit 3: One year forward P-E ratio across select developing and developed countries
(x)
20.0
18.0
16.0
14.0
12.0
10.0
8.0
6.0
4.0
2.0
-
Source: IMF, Angel Research
Market Outlook
July 10, 2018
Exhibit 4: Relative performance of indices across globe
Returns (%)
Country
Name of index
Closing price
1M
3M
1YR
Brazil
Bovespa
74,553
(2.1)
(12.5)
18.5
Russia
Micex
4,484
1.4
7.1
11.4
India
Nifty
10,750
0.8
4.3
11.8
China
Shanghai Composite
2,734
(11.8)
(13.1)
(13.4)
South Africa
Top 40
51,194
(1.8)
3.5
10.5
Mexico
Mexbol
48,563
7.2
1.1
(3.1)
Indonesia
LQ45
906
(6.1)
(12.8)
(8.1)
Malaysia
KLCI
1,691
(3.7)
(8.9)
(4.9)
Thailand
SET 50
1,055
(7.2)
(9.5)
6.7
USA
Dow Jones
24,357
(1.8)
(0.7)
13.7
UK
FTSE
7,603
(1.1)
8.1
3.4
Japan
Nikkei
21,547
(4.4)
1.2
7.0
Germany
DAX
12,464
(3.0)
1.1
0.5
France
CAC
5,366
(1.9)
1.8
2.5
Source: Bloomberg, Angel Research
Market Outlook
July 10, 2018
Exhibit 7: Historical Angel Top Picks/Fundamental Calls
Date Added
Top Picks/Fundamental
Stocks
Reco Price
Target/Revised Price
Current Status
20-06-2018
Top Picks
Shriram Transport Finance Com
1,466
1,764
Open
01-07-2018
Top Picks
Bata India
862
948
Open
18-06-2018
Top Picks
Bata India
779
896
14-06-2018
Top Picks
Amber Enterprises
1,026
1,230
Open
07-06-2018
Top Picks
M&M
918
1050
Open
04-05-2018
Top Picks
M&M
860
990
03-05-2018
Fundamental
L&T Finance Holding
171
210
Open
02-05-2018
Top Picks
HDFC Bank
1944
2315
Open
04-05-2018
Top Picks
Matrimony.com Ltd
810
1016
Open
20-04-2018
Top Picks
Matrimony.com Ltd
781
984
15-05-2018
Top Picks
Parag Milk Foods Limited
310
410
Open
16-04-2018
Top Picks
Parag Milk Foods Limited
249
333
29-06-2018
Fundamental
GMM Pfaudler Limited
932
1,020
Open
14-05-2018
Fundamental
GMM Pfaudler Limited
818
900
06-04-2018
Fundamental
GMM Pfaudler Limited
712
861
07-03-2018
Fundamental
Ashok Leyland Ltd
139
163
Closed (26/04/2018)
03-03-2018
Fundamental
Greenply Industries
340
395
Open
16-04-2018
Top Picks
Safari Industries
651
750
Open
21-02-2018
Top Picks
Safari Industries
532
650
31-05-2018
Top Picks
HSIL Ltd
348
Closed (31/05/2018)
16-02-2018
Top Picks
HSIL Ltd
433
510
07-02-2018
Fundamental
Elantas Beck India Ltd.
2155
2500
Open
01-02-2018
Top Picks
ICICI Bank
352
416
Open
01-02-2018
Top Picks
Aditya Birla Capital
167
218
Open
04-01-2018
Fundamental
CCL Products
278
360
Open
03-01-2018
Fundamental
Nilkamal Ltd
1880
2178
Open
01-01-2018
Fundamental
Capital First Ltd
693
850
Closed (15/01/2018)
30-12-2017
Fundamental
Shreyans Industries Ltd
205
247
Closed
Fundamental
Prism Cement Ltd
160
Closed (09/05/2018)
21-12-2017
Fundamental
Prism Cement Ltd
118
131
18-12-2017
Fundamental
Menon Bearings Limited
92
114
Closed (17/01/2018)
14-12-2017
Top Picks
Ruchira Papers Ltd.
188
244
Closed (09/02/2018)
17-05-2018
Top Picks
Century Plyboards India
280
Closed(17/05/2018)
28-11-2017
Top Picks
Century Plyboards India
317
400
19-12-2017
Top Picks
LT Foods
85
Closed(18/06/2018)
06-11-2017
Top Picks
LT Foods
74
96
16-10-2017
Fundamental
Endurance Technologies Ltd
1111
1277
Closed (01/12/2017)
11-09-2017
Top Picks
GIC Housing
533
655
Open
10-10-2017
Top Picks
Music Broadcast Limited
404
475
Open
20-07-2017
Top Picks
Music Broadcast Limited
368
434
07-07-2017
Fundamental
L&T Finance Holdings Ltd
149
179
Closed (28/8/2017)
06-07-2017
Fundamental
Syngene International
478
564
Closed (1/3/2018)
05-07-2017
Top Picks
Maruti
7371
10619
Open
05-06-2017
Top Picks
Karur Vysya Bank
127
100
Closed (12/03/2018)
23-05-2018
Top Picks
KEI Industries
481
589
Open
Source: Company, Angel Research
Market Outlook
July 10, 2018
Exhibit 8: Historical Angel Top Picks/Fundamental Calls
Date Added
Top Picks/Fundamental
Stocks
Reco Price
Target/Revised Price
Current Status
04-01-2017
Top Picks
KEI Industries
125
485
31-05-2018
Top Picks
Alkem Lab
1978
Closed (31/05/2018)
01-12-2016
Top Picks
Alkem Lab
1700
2441
17-10-2016
Top Picks
Asian Granito
267
534
Closed (18/02/2018)
17-05-2018
Top Picks
TV Today Network
460
Closed (17/05/2018)
04-08-2016
Top Picks
TV Today Network
297
603
05-04-2016
Top Picks
DHFL
189
720
Open
25-06-2018
Top Picks
Navkar Corporation
207
Closed(25/06/2018)
05-01-2016
Top Picks
Navkar Corporation
207
265
Open
08-12-2015
Top Picks
Blue Star
357
867
Open
30-10-2015
Top Picks
Siyaram Silk Mills
186
851
Open
Source: Company
Market Outlook
July 10, 2018
Research Team Tel: 022 - 39357800
DISCLAIMER
Angel Broking Private Limited (hereinafter referred to as “Angel”) is a registered Member of National Stock Exchange of India
Limited,Bombay Stock Exchange Limited and Metropolitan Stock Exchange Limited. It is also registered as a Depository Participant with
CDSL and Portfolio Manager with SEBI. It also has registration with AMFI as a Mutual Fund Distributor. Angel Broking Private Limited is
a registered entity with SEBI for Research Analyst in terms of SEBI (Research Analyst) Regulations, 2014 vide registration number
INH000000164. Angel or its associates has not been debarred/ suspended by SEBI or any other regulatory authority for accessing
/dealing in securities Market. Angel or its associates/analyst has not received any compensation / managed or co-managed public
offering of securities of the company covered by Analyst during the past twelve months.
This document is solely for the personal information of the recipient, and must not be singularly used as the basis of any investment
decision. Nothing in this document should be construed as investment or financial advice. Each recipient of this document should
make such investigations as they deem necessary to arrive at an independent evaluation of an investment in the securities of the
companies referred to in this document (including the merits and risks involved), and should consult their own advisors to determine
the merits and risks of such an investment.
Reports based on technical and derivative analysis center on studying charts of a stock's price movement, outstanding positions and
trading volume, as opposed to focusing on a company's fundamentals and, as such, may not match with a report on a company's
fundamentals. Investors are advised to refer the Fundamental and Technical Research Reports available on our website to evaluate the
contrary view, if any.
The information in this document has been printed on the basis of publicly available information, internal data and other reliable
sources believed to be true, but we do not represent that it is accurate or complete and it should not be relied on as such, as this
document is for general guidance only. Angel Broking Pvt. Limited or any of its affiliates/ group companies shall not be in any way
responsible for any loss or damage that may arise to any person from any inadvertent error in the information contained in this report.
Angel Broking Pvt. Limited has not independently verified all the information contained within this document. Accordingly, we cannot
testify, nor make any representation or warranty, express or implied, to the accuracy, contents or data contained within this document.
While Angel Broking Pvt. Limited endeavors to update on a reasonable basis the information discussed in this material, there may be
regulatory, compliance, or other reasons that prevent us from doing so.
This document is being supplied to you solely for your information, and its contents, information or data may not be reproduced,
redistributed or passed on, directly or indirectly.
Neither Angel Broking Pvt. Limited, nor its directors, employees or affiliates shall be liable for any loss or damage that may arise from
or in connection with the use of this information.